Scrutiny Rock-on
Before you install the Scrutiny rock-on, you should understand the prerequisites and configurations common to all Rockstor Rock-ons (Docker Plugins); specifically the Initial Rock-ons Setup and The Rock-ons root requirements.
What is Scrutiny
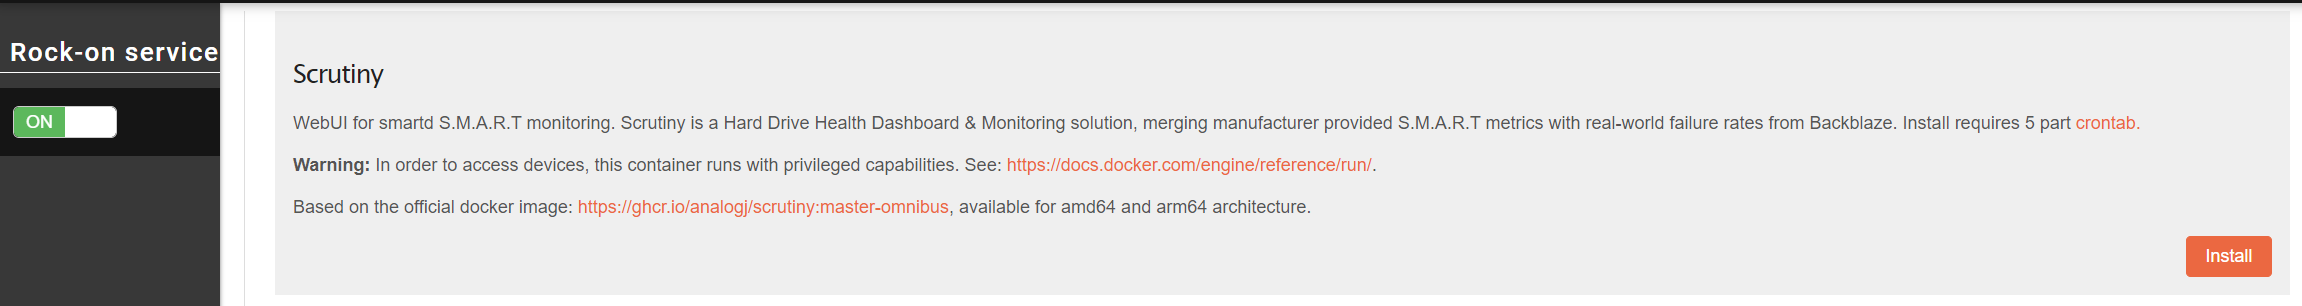
Scrutiny is a Hard Drive Health Dashboard & Monitoring solution, merging manufacturer provided S.M.A.R.T metrics with real-world failure rates.
Introduction from Scrutiny documentation
If you run a server with more than a couple of hard drives, you’re probably
already familiar with S.M.A.R.T and the smartd daemon. If not, it’s an
incredible open source project described as the following:
smartd is a daemon that monitors the Self-Monitoring, Analysis and Reporting Technology (SMART) system built into many ATA, IDE and SCSI-3 hard drives. The purpose of SMART is to monitor the reliability of the hard drive and predict drive failures, and to carry out different types of drive self-tests.
Theses S.M.A.R.T hard drive self-tests can help you detect and replace failing
hard drives before they cause permanent data loss. However, there’s a couple
issues with smartd:
There are more than a hundred S.M.A.R.T attributes, however
smartddoes not differentiate between critical and informational metricssmartddoes not record S.M.A.R.T attribute history, so it can be hard to determine if an attribute is degrading slowly over time.S.M.A.R.T attribute thresholds are set by the manufacturer. In some cases these thresholds are unset, or are so high that they can only be used to confirm a failed drive, rather than detecting a drive about to fail.
smartdis a command line only tool. For head-less servers a web UI would be more valuable.
Scrutiny Configuration
By default Scrutiny looks for its YAML configurations files located in the share:
/mnt2/Scrutiny-Config-Share/scrutiny.yaml
There are two configuration files available:
Webapp/API config via
scrutiny.yaml- example.scrutiny.yaml.Collector config via
collector.yaml- example.collector.yaml.
Neither file is required, however if provided, it allows you to configure how Scrutiny functions.
Notifications
Scrutiny supports sending SMART device failure notifications via the following services: - Custom Script (data provided via environmental variables) - Email - Webhooks - Discord - Gotify - Hangouts - IFTTT - Join - Mattermost - Pushbullet - Pushover - Slack - Teams - Telegram - Tulip
Check the notify.urls section of example.scrutiny.yaml
for more information and documentation for service specific setup.
Here is a basic example for email notifications:
notify:
   level: 'warn' # 'warn' or 'error'
   urls:
      - "smtp://mail@address.org:password@smtp.server.org:465/?fromAddress=mail@address.org&toAddresses=mail2@address.org"
More information can be found on Scrutiny GitHub
Installing the Scrutiny rock-on
This Rock-on requires a share to store the config files, a group ID (GID) and user ID (UID) of the owner for that share. In this case, we will create a specific share and a user.
Pre-installation requirements
First, navigate to System > Users, and create a new user:
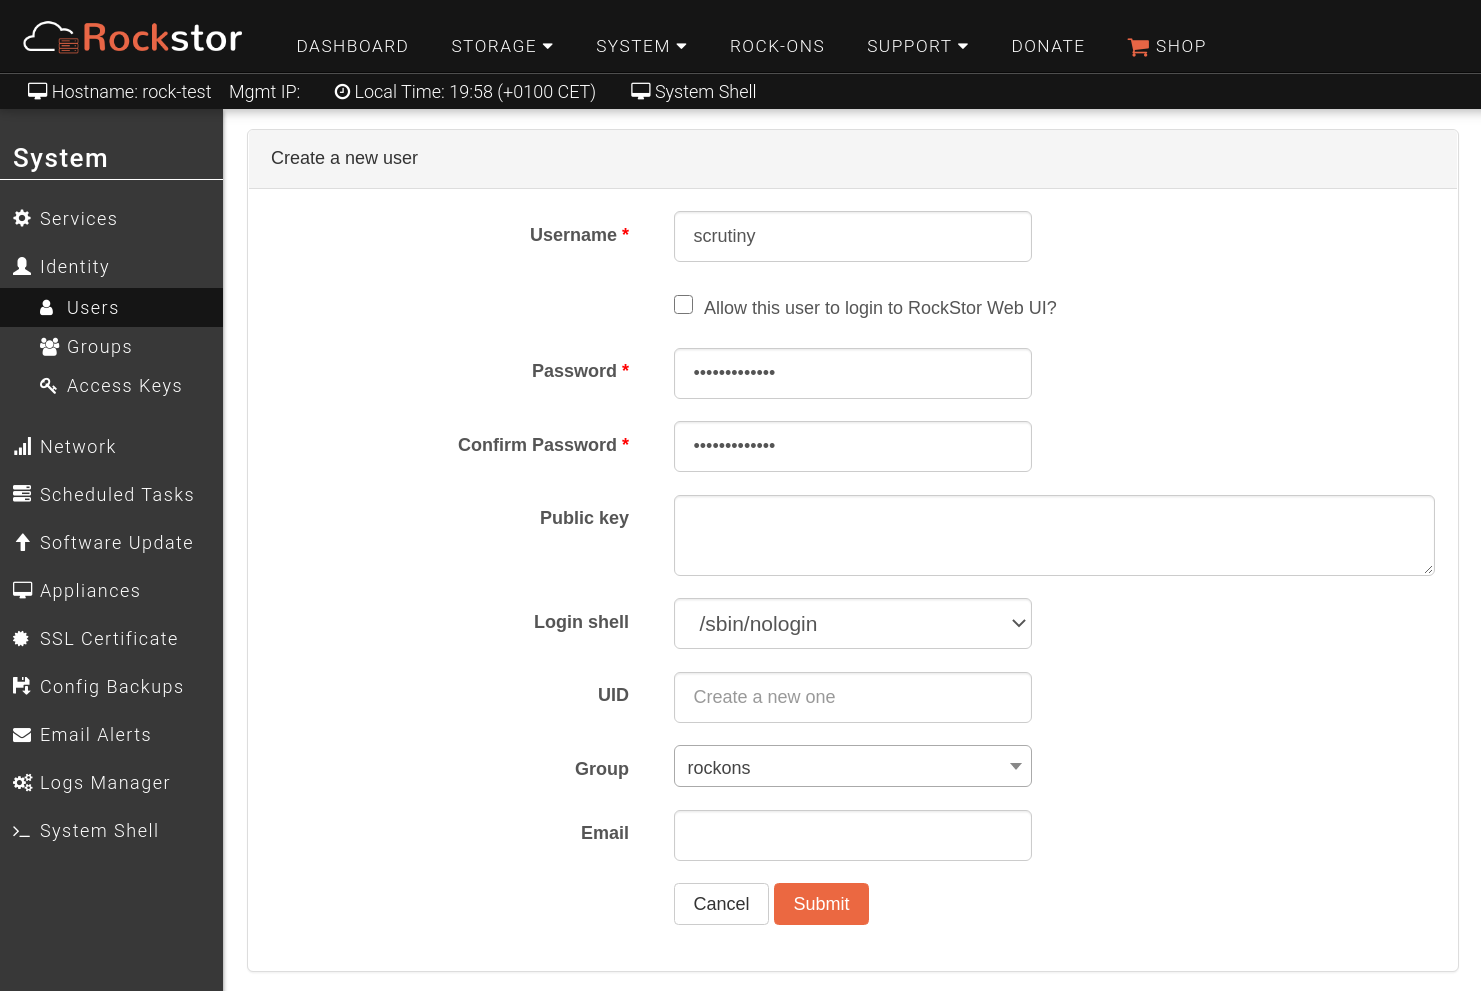
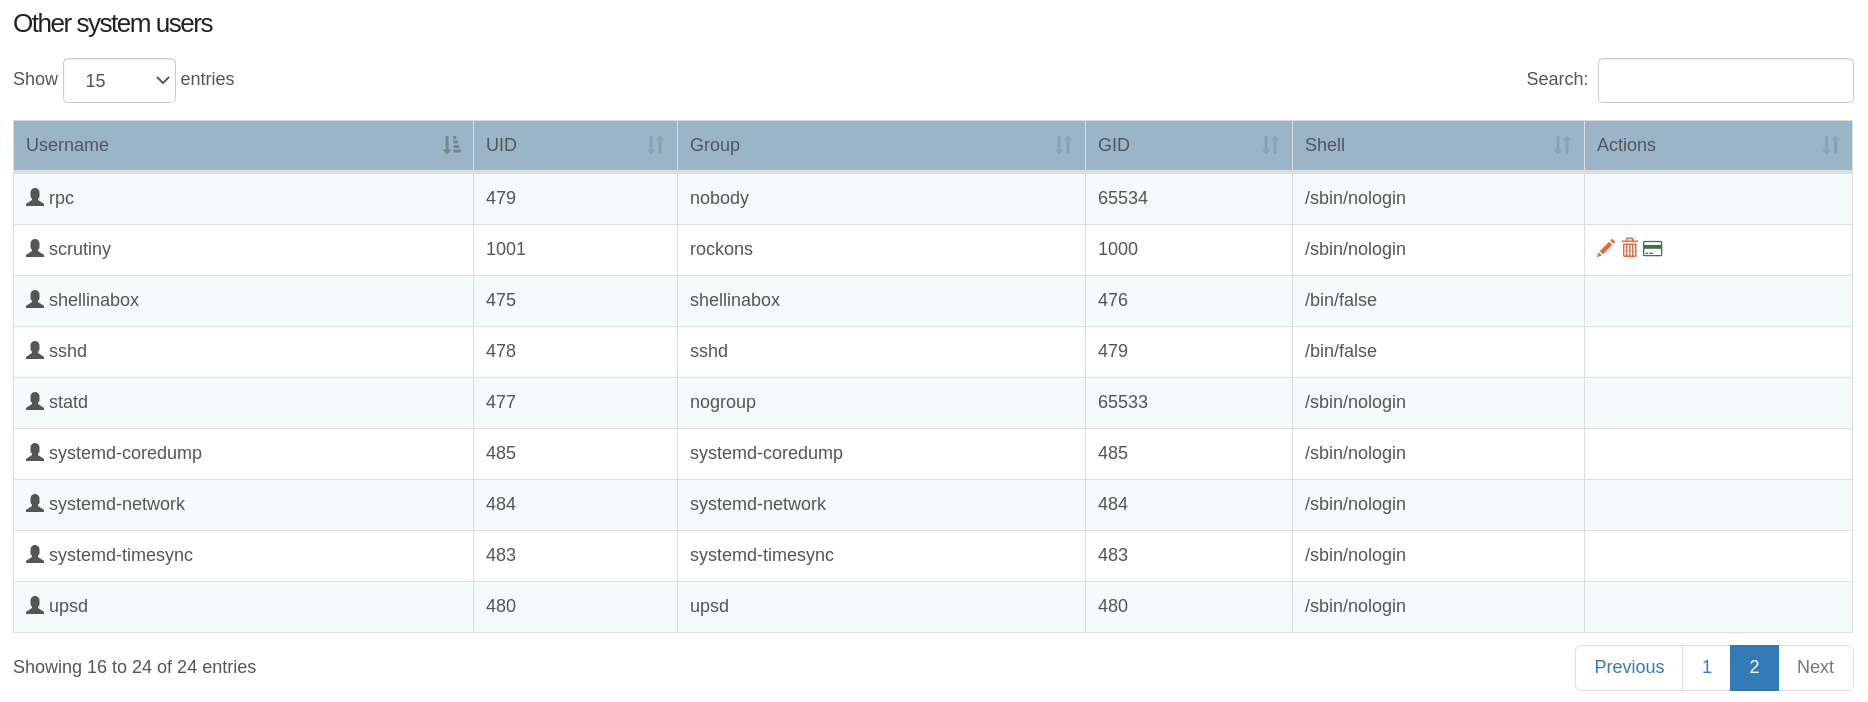
Take note of the new user ID (UID), you will need this during the installation of the Rock-on.
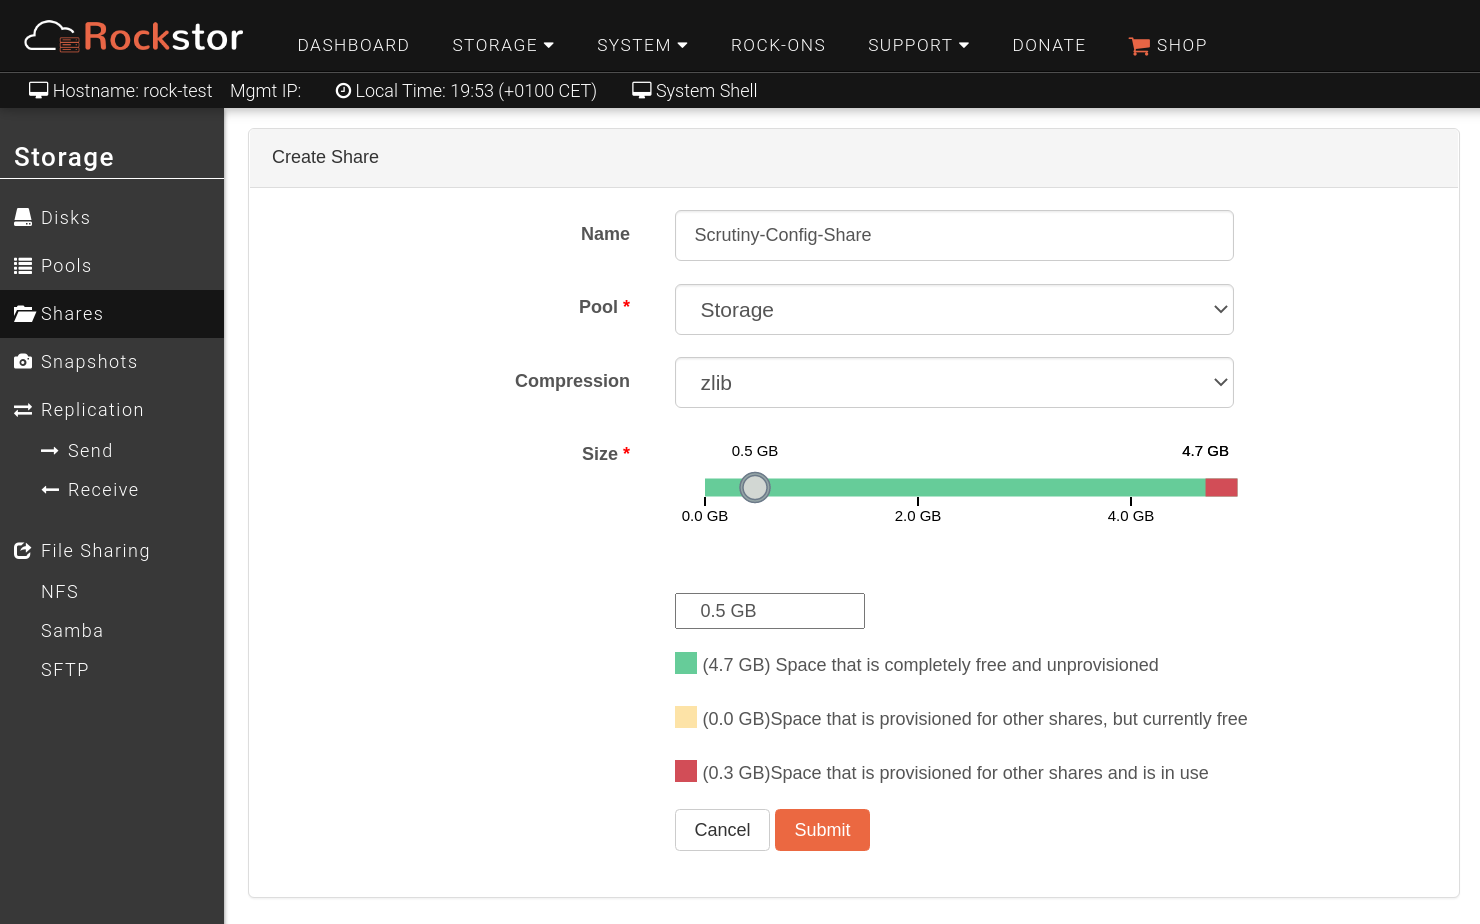
Then navigate to Storage > Shares, and create a new share:
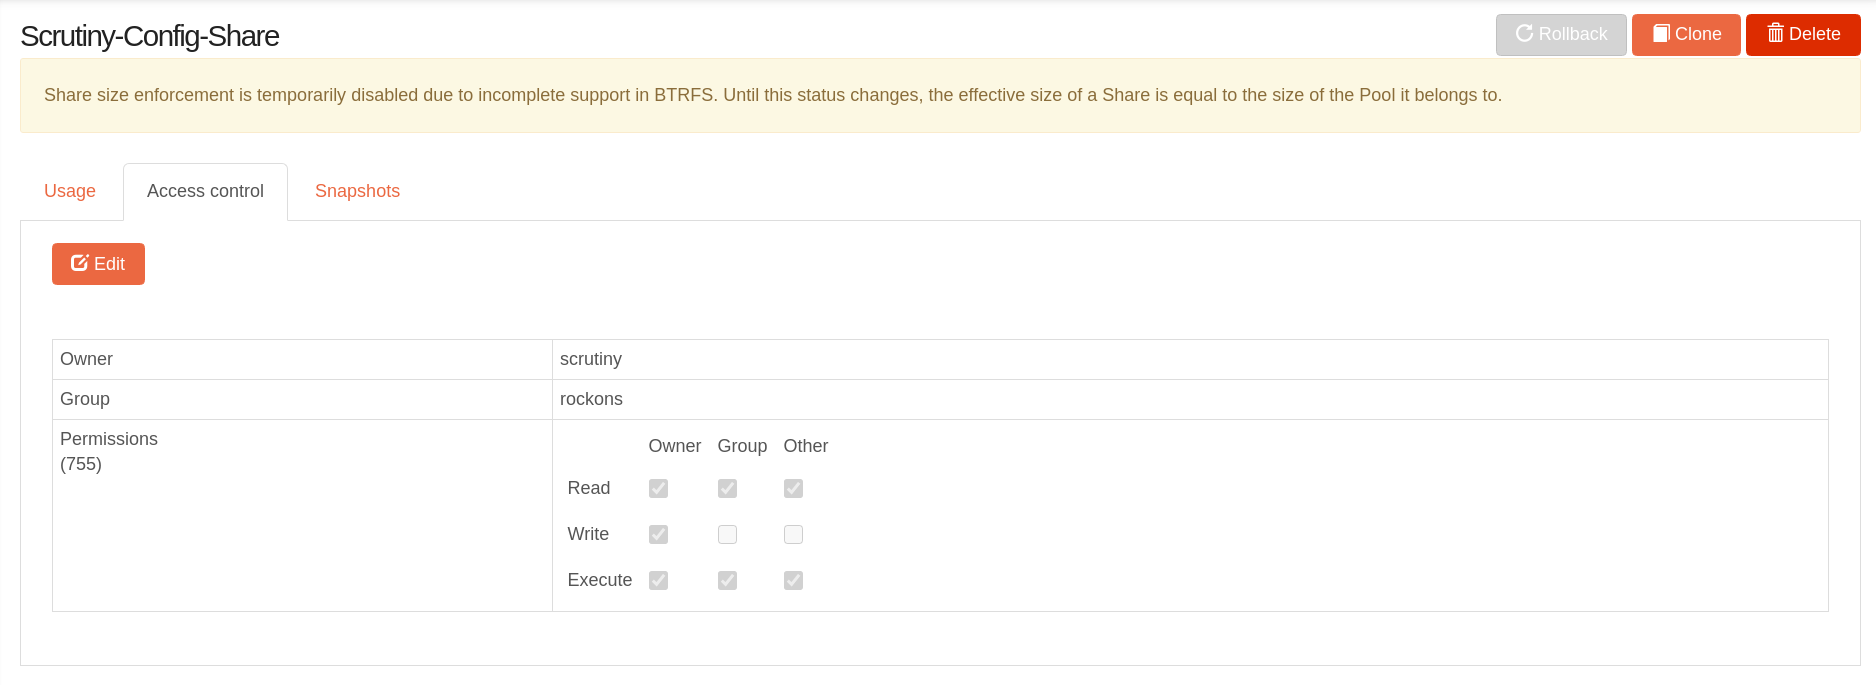
Select the newly created share and navigate to the Access control tab then click Edit and select “scrutiny” user as owner.
Scrutiny rock-on installation
Now, navigate to Rock-ons and click the Update button, once the refresh is done, you will be in the tab with all Rock-ons. Search for “Scrutiny” Rock-on and click Install button.
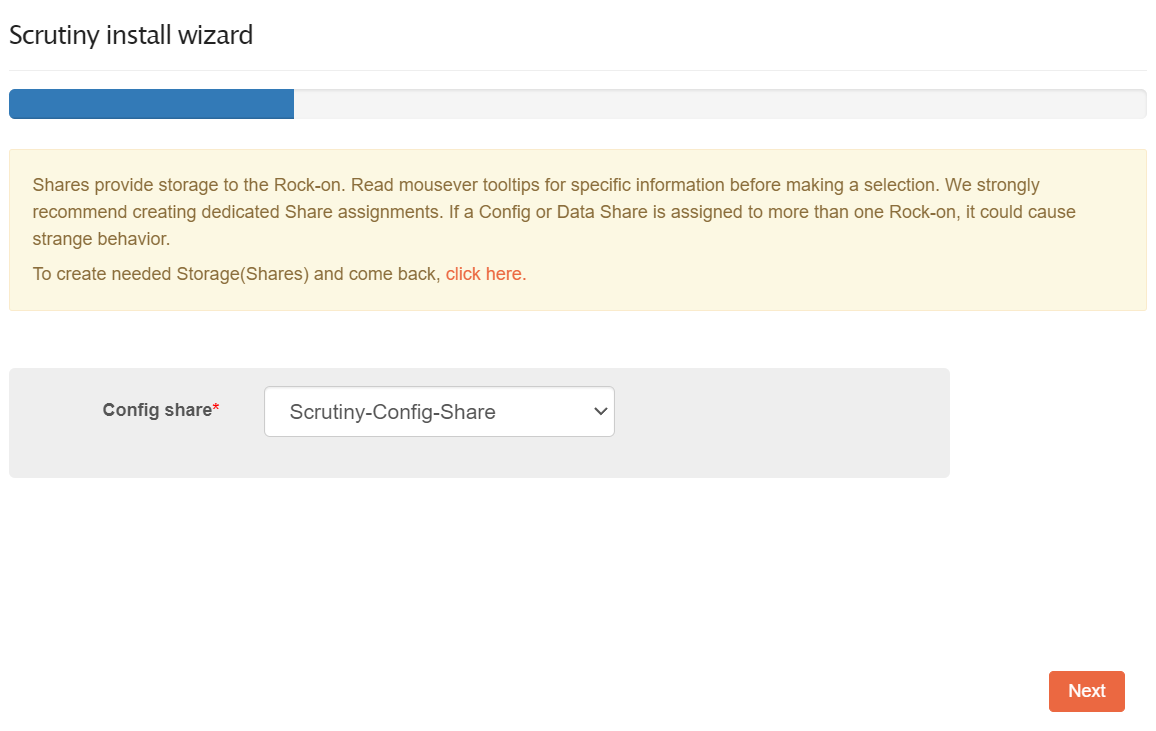
In the first step of the wizard, select the “Scrutiny-Config-Share” created earlier:
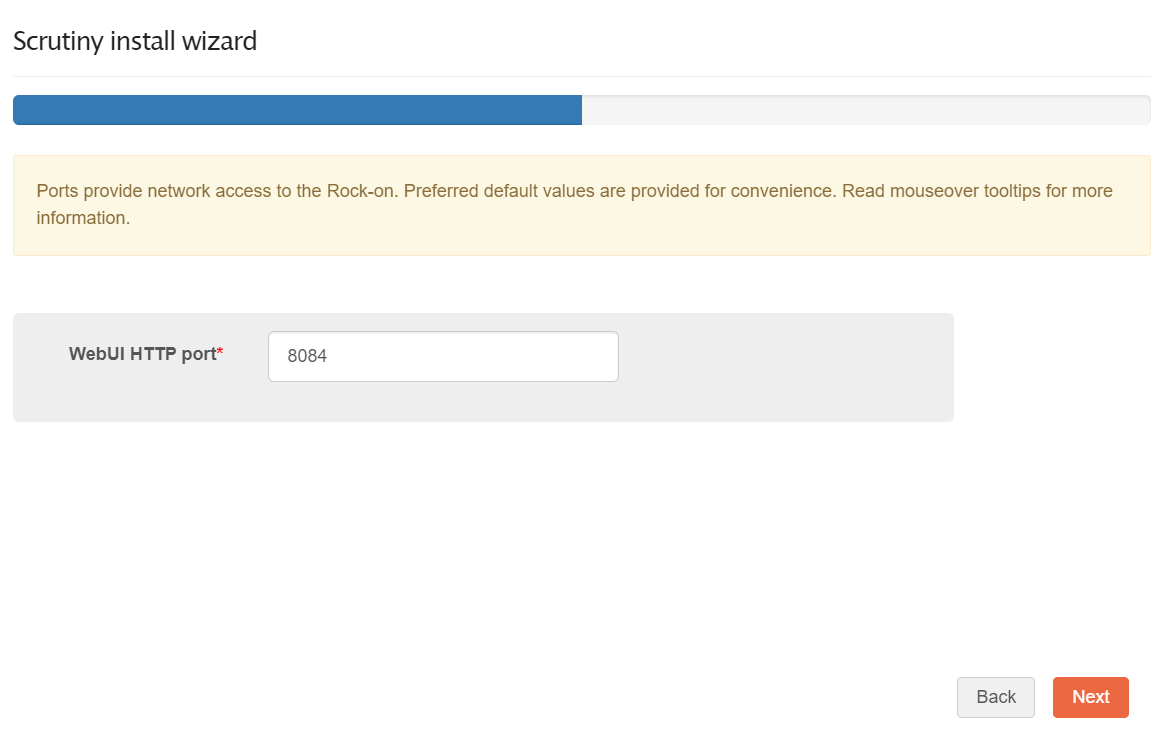
Step 2, enter a port number that is not in use by another rock-on (Default 8080).
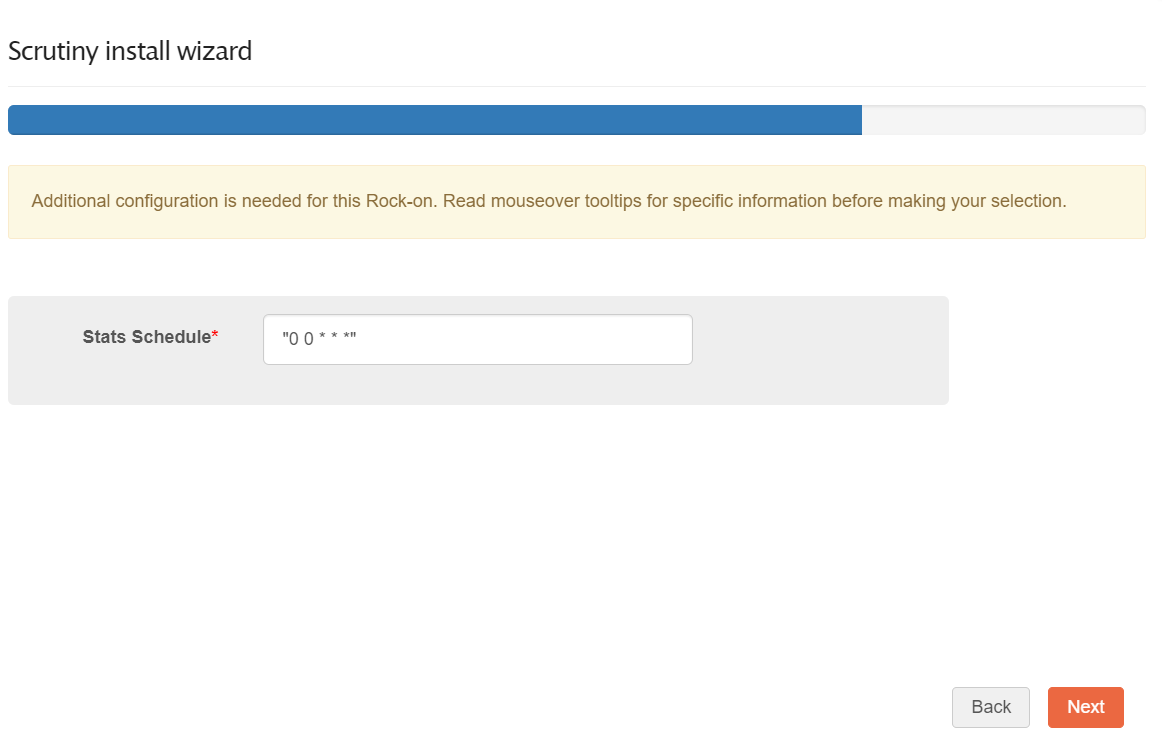
Step 3, enter a CRON expression, which manages when the statistics will be collected.
The CRON expression used here contains 5 parts. For a handy tool to create this expression, use something like https://crontab-generator.com/.
In this example, to schedule the data collection at midnight every day, the expression would be 0 0 * * *.
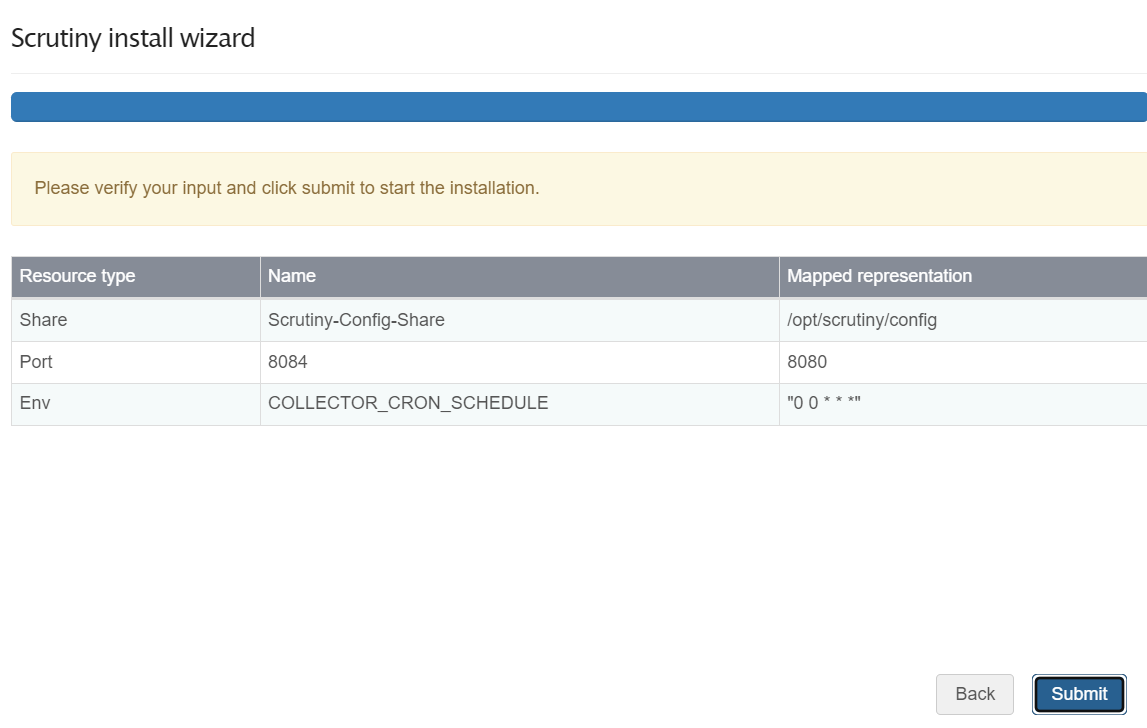
Step 4, review your configuration, then click Submit to start the Rock-on installation.
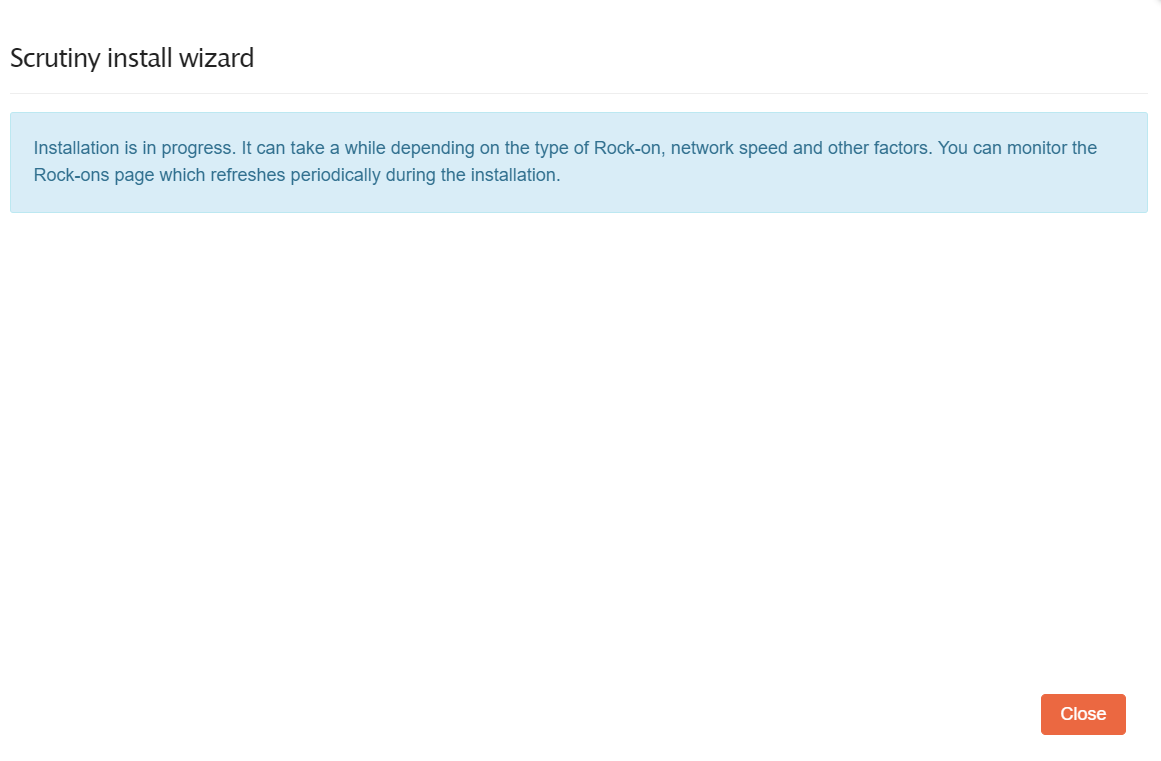
Step 5, with the installation in progress, close the wizard.
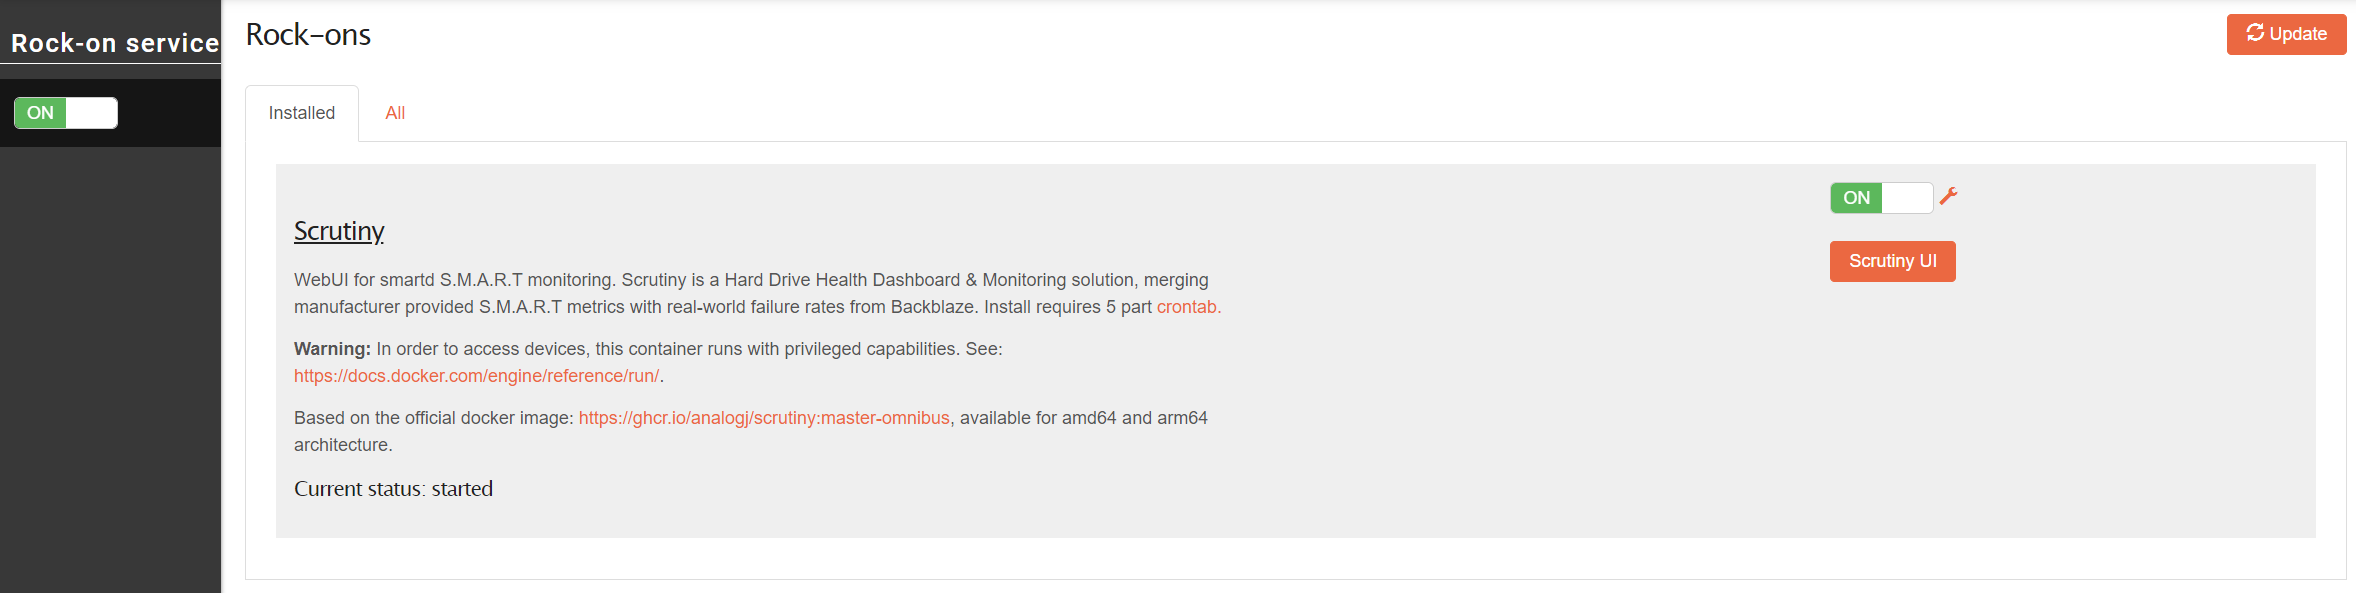
Once the installation finishes, use the Scrutiny UI button to go to the web interface to view and monitor all the metrics collected from your server disks.
Scrutiny initial configuration
No Devices detected!
Right after the installation, when accessing the Scrutiny UI, the dashboard can be empty. However, newer versions of the underlying container automatically trigger the data collection at the first startup.
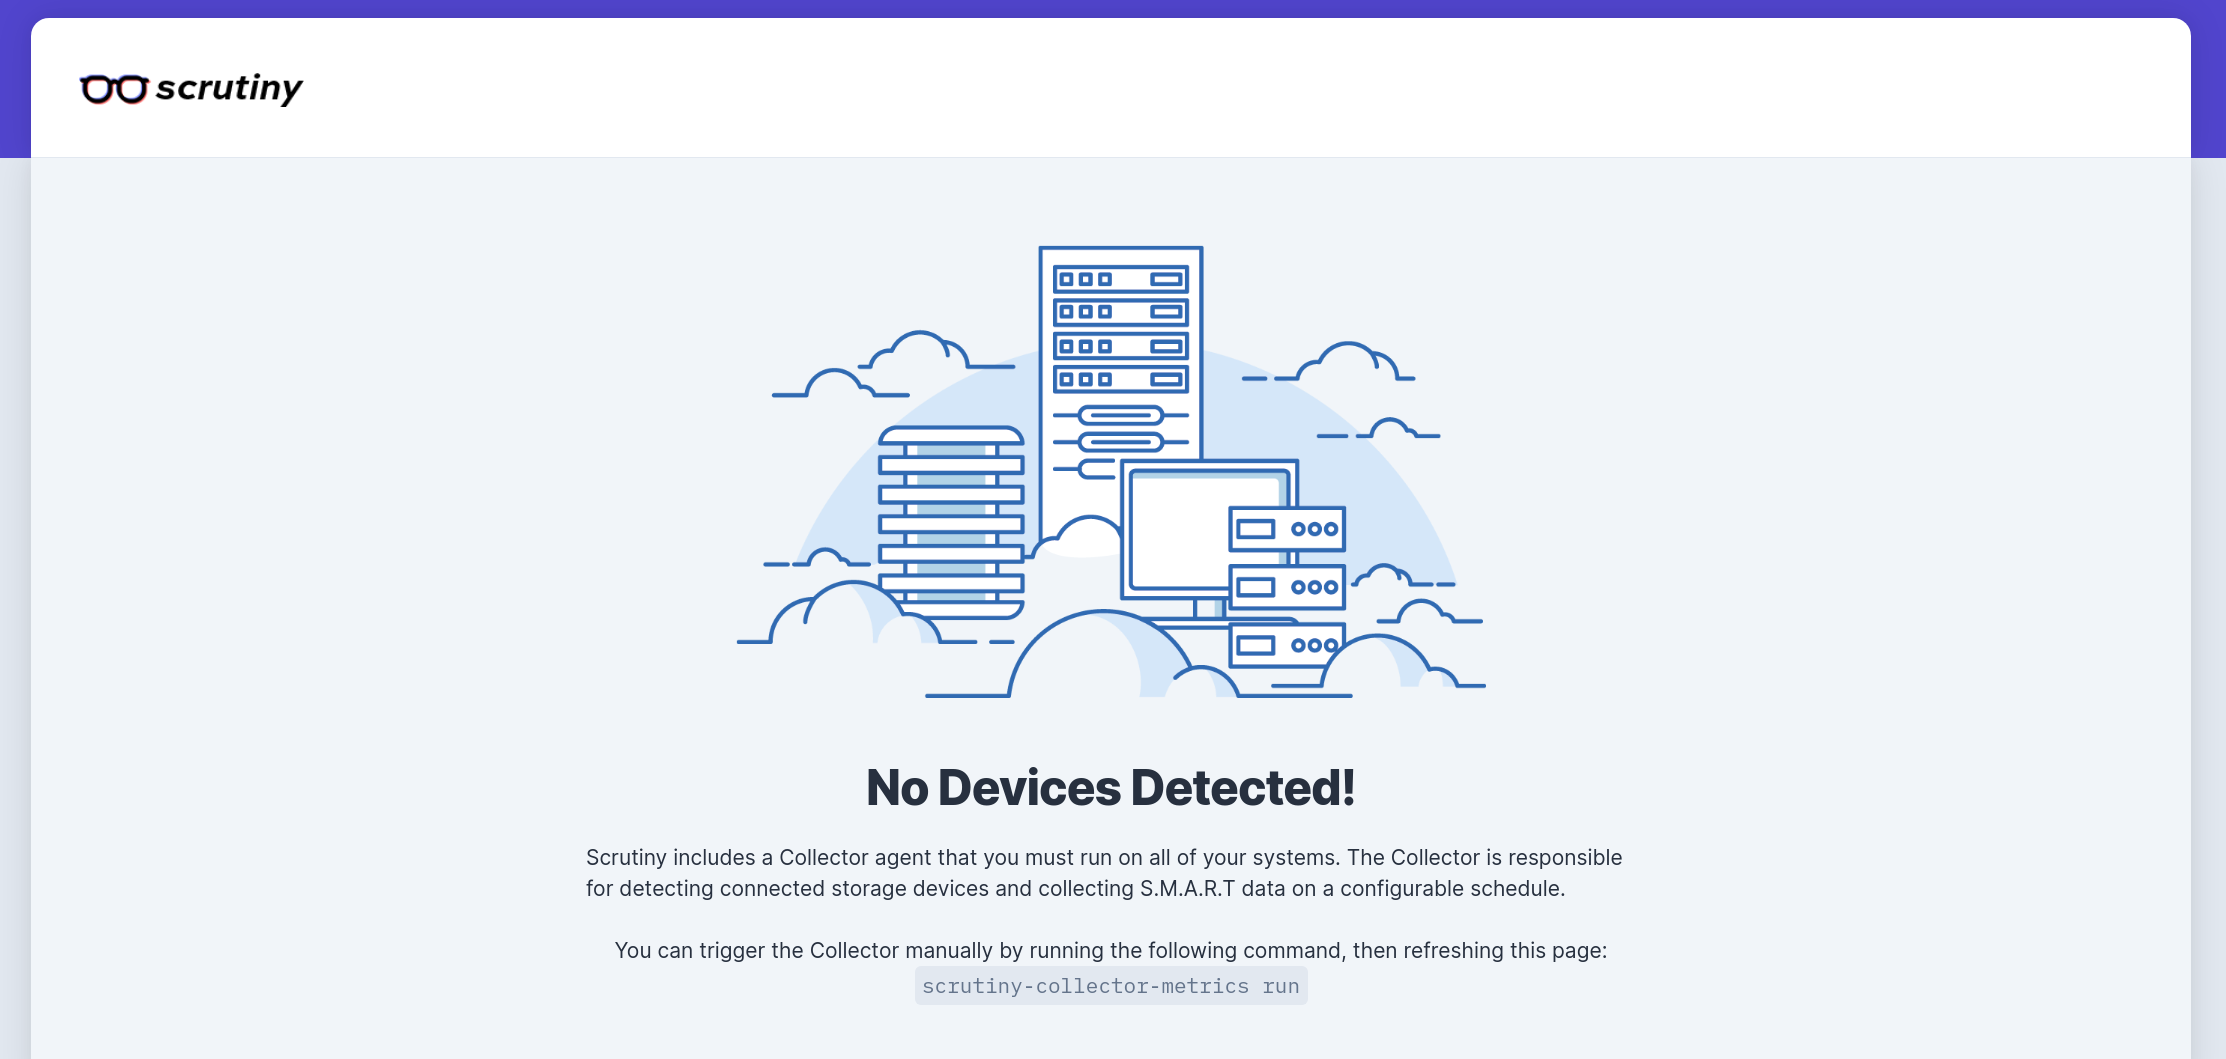
Why? Because the container is using a cron schedule to refresh all data periodically. In the above example it would not be collecting statistics before midnight for the first time. You can wait for the next scheduled refresh, or you can do it manually.
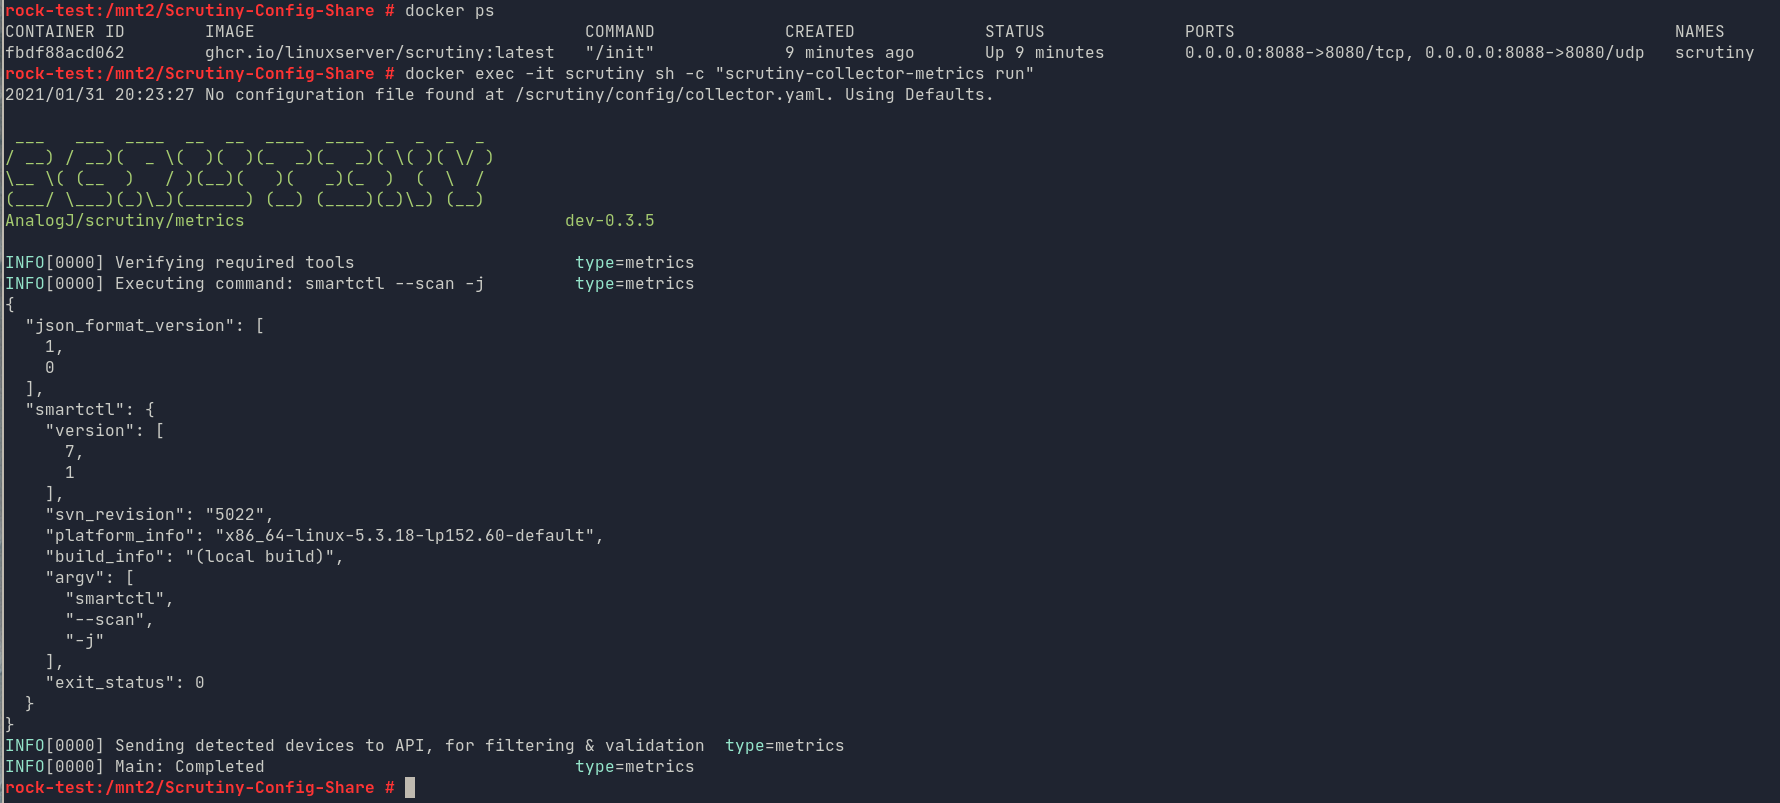
Manual refresh
In order to refresh the dashboad manually, you must connect to your Rockstor server via SSH (or use the server terminal directly if the server is connected to a monitor and keyboard) and type the following command:
docker exec -it scrutiny sh -c "scrutiny-collector-metrics run"
Scrutiny Rockon Installation Successful
Congratulations! You successfully installed and configured Scrutiny, your dashboard should now be filled with valuable information about all your disks:
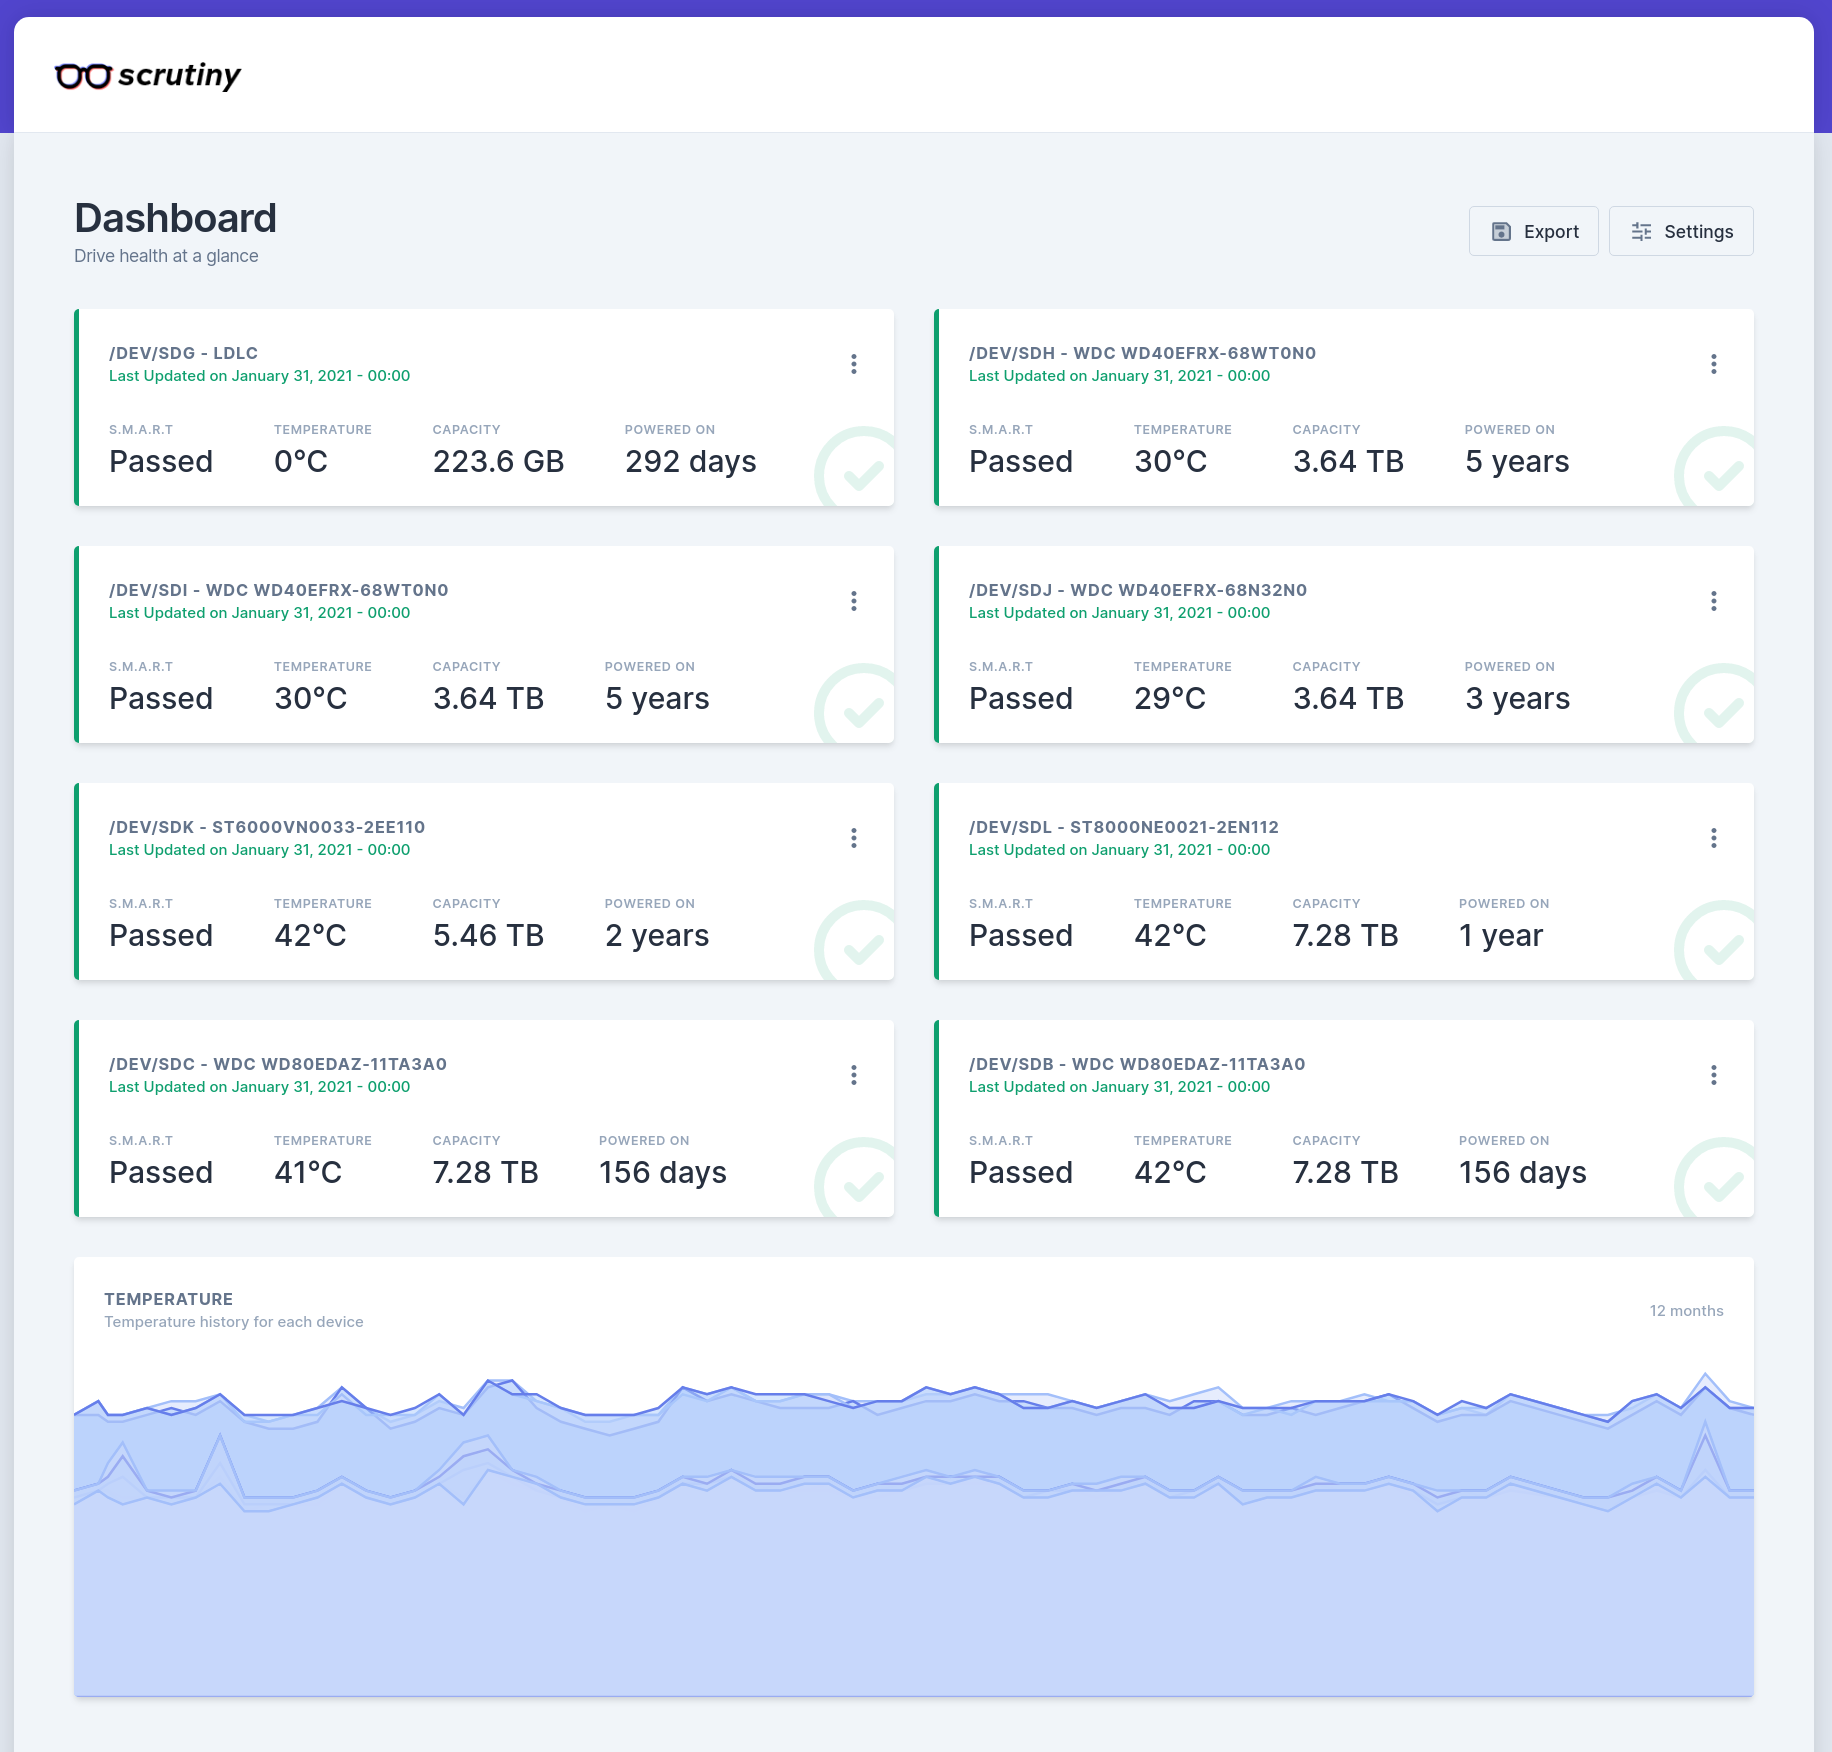
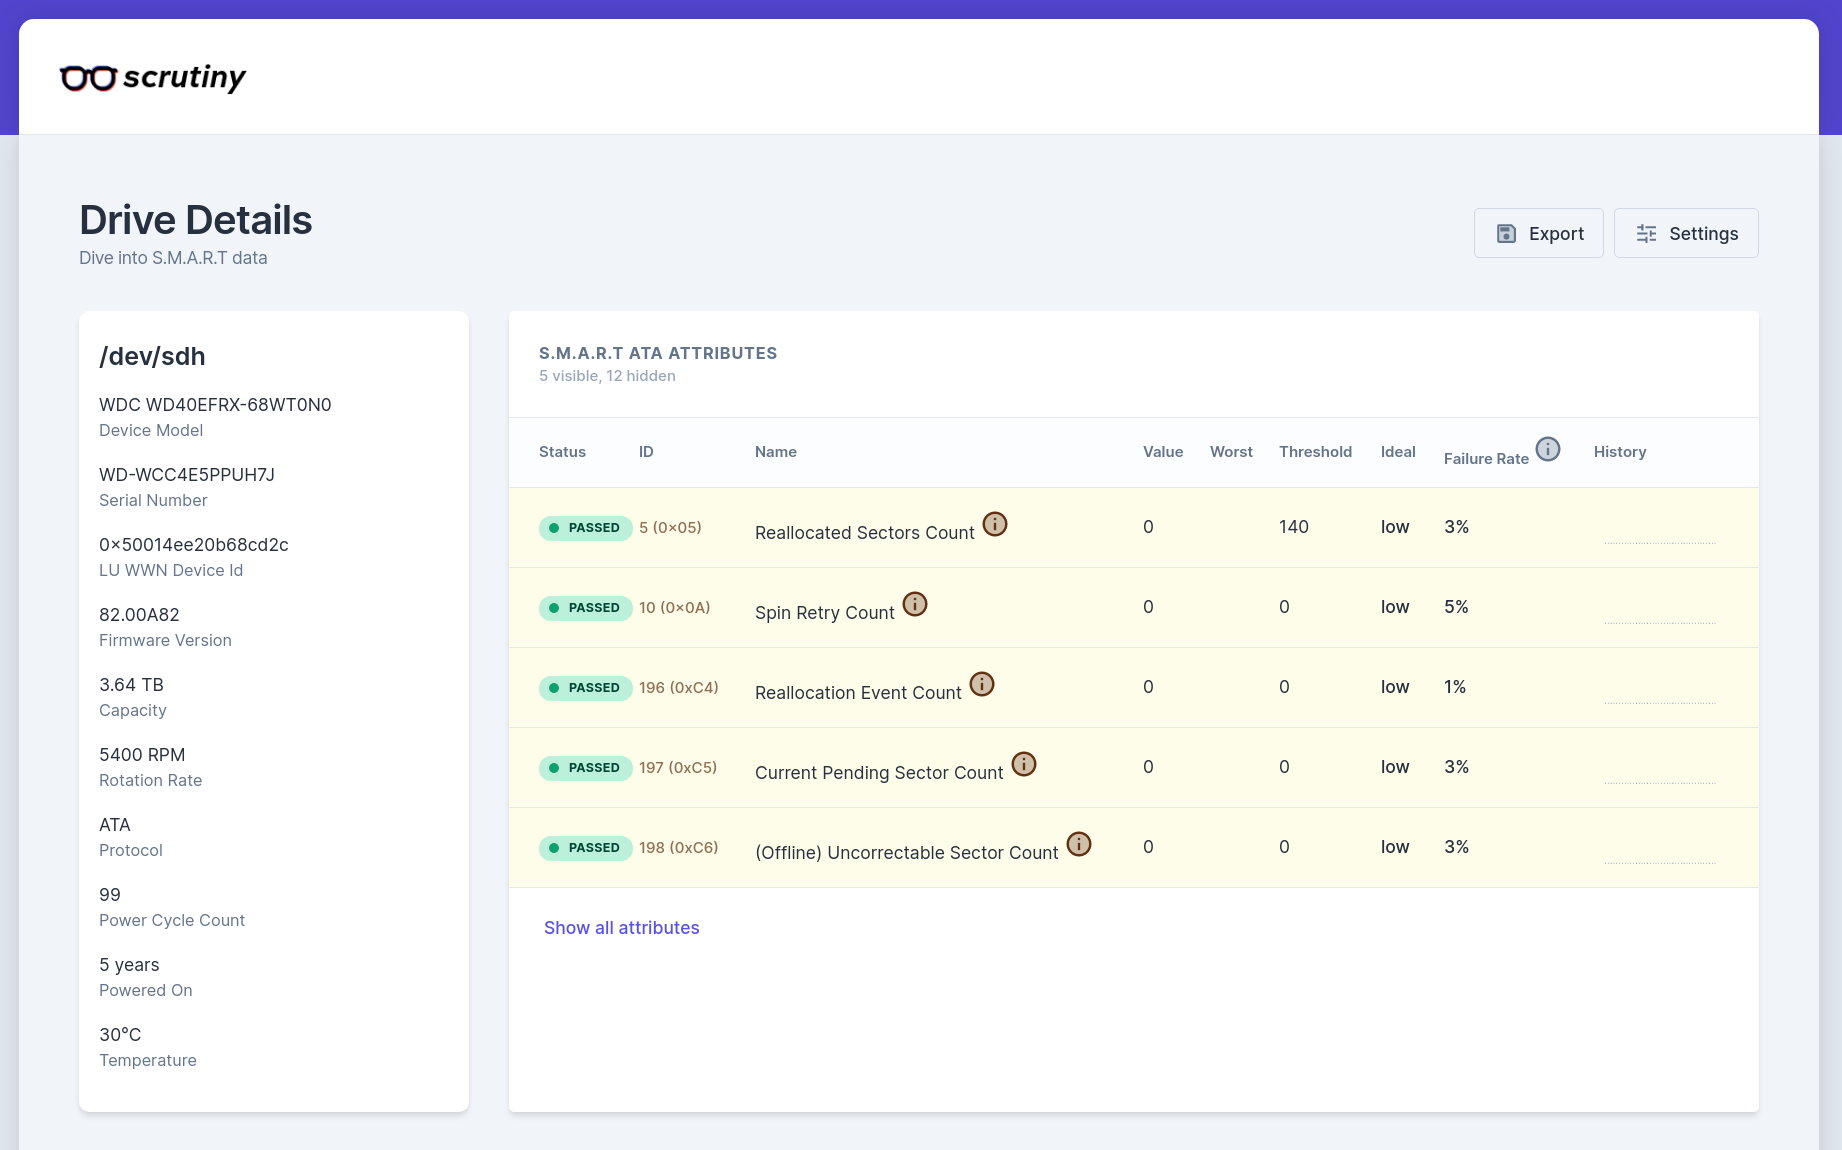
More detailed information is available for each disks as well:
More options and configurations
A fully commented example configuration yaml file can be found in the original project repository here. You can modify the file scrutiny.yaml located in the share “Scrutiny-Config-Share”.
Warning
WARNING If smartd is not working or doesn’t list any device,
(like in a VM) the dashboard will remain empty!
