Dashboard
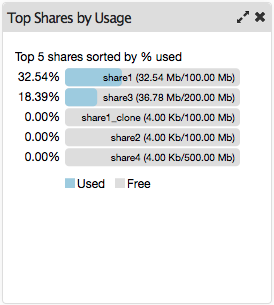
The Rockstor dashboard is a view for an admin to rapidly monitor the storage, compute and network resources of the appliance.
The dashboard is designed as a configurable set of widgets, each displaying information about the resources mentioned above. Here are some features of the dashboard that enhance user experience.
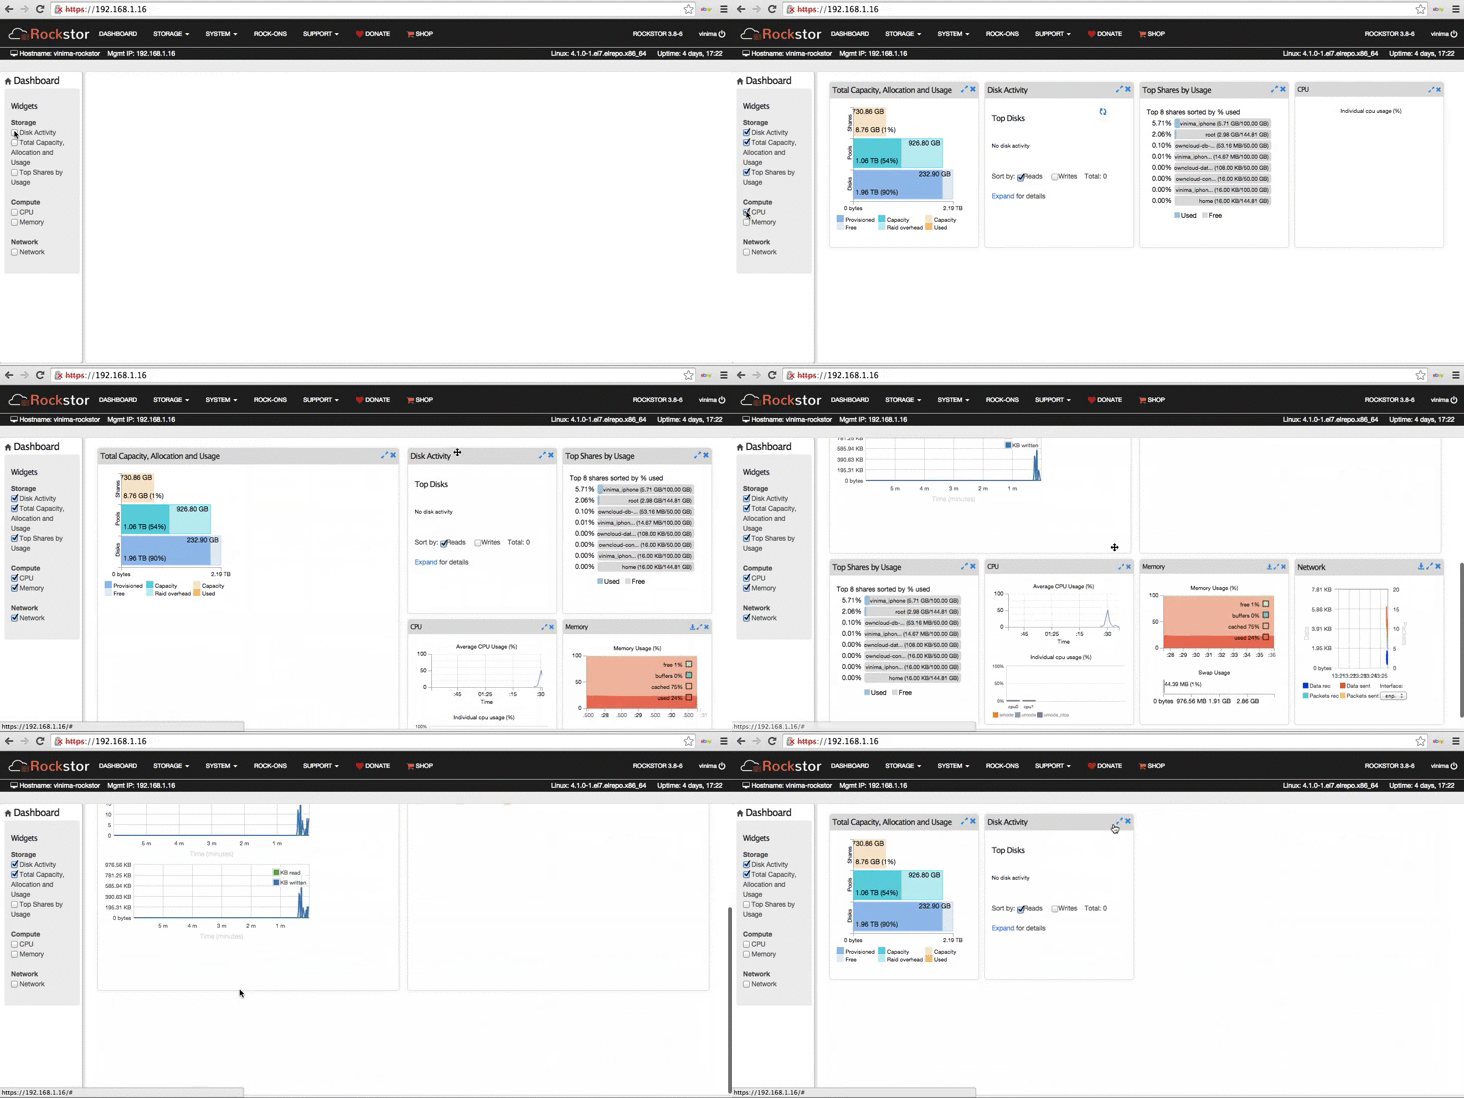
Widgets can be selected or deselected from the left sidebar to create a custom dashboard. They can also be deselected by clicking the X icon on the top right.
Widgets can be rearranged, maximized and minimized to customize the layout.
The new configuration is automatically saved for future logins.
Dashboard Widgets
Widgets have two states, compact and expanded. They can be toggled between the two states by clicking the resize icon located at the top right of each widget. The compact state displays minimal information required for monitoring a particular resource, and the expanded state displays more detail, and may have more functionality like viewing history of the resource etc.
CPU Widget
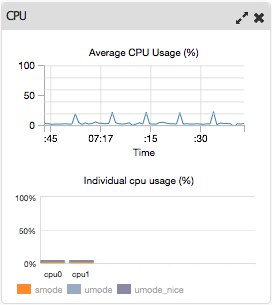
The CPU widget displays the cpu usage of the appliance and is updated every second. The top graph of the cpu widget displays the average cpu usage of the appliance, and the bottom graph displays the percent of time spent in system mode, user more and user mode nice, for each cpu, for the current time interval.
Memory Widget
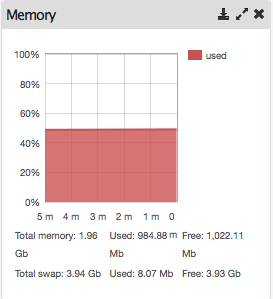
The memory widget displays a graph of memory usage over the last 5 minutes.
Disk activity Widget
The disk activity widget displays the top 5 disks sorted by read/write activity. Activity can be sorted by reads, writes or both.
Network activity Widget
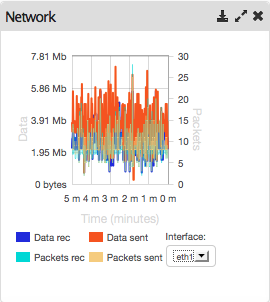
The network activity widget displays data sent/received, and packets sent/received for the selected network interface, over the last 5 minutes.
